
The Economics Of Immigration, Part 1
David Stockman
David Stockman
2/4/20265 min read


Talk about fiddling while Rome burns. Donald Trump and his unhinged immigrant bashers surely take the cake.
They are rushing headlong into a mass deportation campaign based on an “immigrant invasion” narrative that is both factually wrong and directionally upside-down.
Moreover, ridding the nation of millions of immigrants as demanded by MAGA firebrands like Stephen Miller would actually pose a head-on threat to the very Golden Age of Prosperity that the Donald has made his signature promise.
So we need to get the facts of the big picture straight.
To begin, the reason that there has been a surge of “illegal immigration” in recent years is not because the Democrats have been deliberately importing voters via so-called “open border” policies.
Or that nefarious foreign countries have been emptying their jails and insane asylums.
Or even that fuzzy-headed leftists and NGOs have thrown out vast welfare-based welcome mats at taxpayer expense.
To the contrary, the real cause is a demography-based shortage in the US labor market that has functioned as a powerful economic magnet drawing in tens of millions of unskilled and entry level economic migrants and their families from nations near and even far.
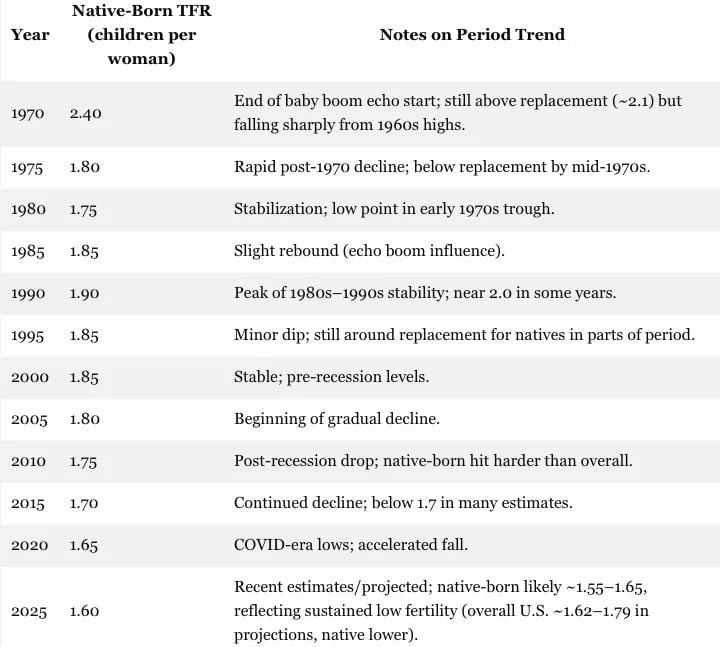
This labor market magnet, in turn, is a function of pure demographics: To wit, the fertility rate among the native born population slipped below the replacement rate about 50 years ago—-thereby creating with a lag of several decades an intensifying US worker shortage.
The table below narrates the fertility rate decline at five-year intervals since 1970.
Essentially, once the swollen generation of Baby Boomers reached the child-bearing age, they collectively (albeit unconsciously) chose not to replace themselves!
For several decades the TFR (total fertility rate) was only marginally below the replacement level of 2.1, meaning a slow long-term shrinkage of the native born work force.
But since 2015 the rate has taken another leg lower.
Thus, at the current 1.6 TFR, the native born population and work force would shrink by 25% every generation!
US Fertility Rate Of The Native Born Population, 1970 to 2025

Obviously, it takes about 20 years to make a new generation of workers—-and even longer when the TFR is falling owing to delayed average age of child birth.
Not surprisingly, therefore, the TFR decline after 1970 first showed up as a decline in the growth rate of the native-born working age population—with the growth rate dropping from 1.3% per annum during the five years ending in 1970 to just 0.1%during the interval ending in 2005.
America’s Beneficent Immigrant “Invasion” Versus The Trumpian Big Lie, Part 2
There has surely never been a more egregiously wrong, mean-spirited, liberty-threatening “big lie” in all of American history than then Trumpian claim that America has been “invaded” by swarms of dangerous immigrants.
These illicit populations are allegedly infested with vicious criminals, the insane, welfare cheats, drug cartel operatives, secret Chinese agents and other flotsam and jetsam of foreign lands.
The big picture truth, however, is more nearly the opposite.
By Grok 4’s best estimates from the available data, there are about 95 million people in America today who are either immigrants since 1970 or their offspring. That’s fully 28% of the total US population.
Yet crime rates among both the legal immigrant and undocumented immigrant populations are well below those for the native born.
Accordingly, the entire Trumpian narrative about rampant crime among illegal aliens is based exclusively on anecdotes and notorious cases of sometimes beastly criminal acts.
These violent criminal acts are heinous, of course, and their perpetrators should obviously be prosecuted to the maximum extent of the law; and, indeed, that is the very purpose of regular state and local law enforcement.
At the same time, however, you can’t base immigration policy, or any other actions of the state which pertain to broad swaths of the population, on anecdotes and isolated cases.
If you did that for immigration policy, for instance, indigenous Americans should have deported European immigrants long ago.
So for want of doubt and clarification of the Big Picture, we present below the most salient, recent and sound data available on violent crime rates (as defined by the FBI) among native-born, foreign-born and undocumented immigrant populations.
This Texas based data is unique in that it is based on comprehensive arrest records by state and local police departments within the state.
These arrest records are then linked to immigration status from Federal data sources.
Moreover, it covers all felony offenses over a seven-year period from 2012 to 2018.
As it happens, Texas is the only U.S. state that systematically matches arrest data from its Department of Public Safety (DPS) with U.S. Department of Homeland Security (DHS) immigration records.
So the output of these matched records offers unique and unparalleled insight into crime rates by immigration status.
Texas’ proximity to the U.S.-Mexico border is also salient given its large and widely dispersed immigrant population (both documented and undocumented).
In short, this broad, rigorous dataset allows for direct comparisons of crime rates (excluding immigration violations), revealing patterns that are not available elsewhere.
Needless to say, the table below speaks for itself. Total felony arrests among the undocumented population of Texas during this seven year period (third column) were 60% lower than for the native-born population (first column) on a per 100,000 basis.
Likewise, homicide and drug crime rates was als0 60% lower, while the property crime rate was 75% below that of the native born population.
To be sure, a far better and more effective vetting and screening process at US consulates in the home countries of immigrants would potentially eliminate much of the residual population of immigrant criminals that are unfortunately found among all groups.
And, as we explain further below, that could be readily accomplished with a change in America’s rigid but wholly obsolete immigration quota system to an economic migrant focused arrangement.
Violent Crime Rates Per 100,000 In Texas, 2012 to 2018
However, just 24% or 101,172 persons on this list had convictions (either in the US or their home countries) under the FBI’s violent crime categories (homicide, sexual assault, assault, and robbery).
By contrast, the balance consisted of 51,933 convictions for immigration law violations, which are inherent in their illegal status, and 272,326 convictions in non-violent categories.
These latter included the kind of everyday crimes that local law enforcement is geared to handle regardless of the immigration status of perpetrators:
Drug Law Infractions: 56,533 (primarily drug possession/sales/trafficking).
Traffic Offenses: 49,000 (frequently including DUI/DWI)
Larceny: 18,234 (theft)
Fraudulent Activities: 15,979 (fraud, forgery, etc.)
Burglary — 14,301 (property crime)
All other: 118,279
MeltingIce.Blog
© 2026. MeltingIce.Blog - All rights reserved.